Last time we talked about the two “pretty boys” of the weather apps I like, and, frankly, as good as they are, they’re not my “go to” choices. Our last two are nice looking, but more info than looks. — and they’re crowdsourced. Before we look at the two apps, let’s look at what “crowdsourcing” means to getting your forecasts, etc.
Crowdsourced Weather
The degree of crowdsourcing used in an app varies. With weather apps, it means two things. The user can choose where he gets his data from. In my case, I live within a city limit, but in what’s closer to a suburban environment. The difference in building size and spacing, the amount of grass and tree space, the difference in terrain are all things that will affect temperature and forecasts. So by being able to select a source close to home, I can get a potentially more accurate reflection of conditions nearby.
Crowdsourcing allows the app’s dev gets a lot more data points to create the info he serves to the user, and the forecasts can more accurately show the probabilities in the area surrounding the local weather station.
There’s a possible downside to crowdsourcing. It uses weather stations set up and maintained by individual enthusiasts. While they generally are going to be really good at keeping things in good working order, that’s not guaranteed. Almost 100% of the time we choose a station location because of proximity, not because we know who runs it. So it’s always good to check info against other local stations periodically.
Weatherbug

Weatherbug is one of the granddaddies of weather apps, and with good reason. Our left screenshot is the main or “Now” screen. Yes you do get served an ad before getting there, but you can exit to the main screen quickly without paying much attention to the ad. Below what’s in the screenshot, there are maps, lightning proximity, weather photo galleries, cams, various lifestyle & health outlooks, forecast video, and hurricane info. The lifestyle and health feature seems to be US only.
The next two screenshots are from the Details page. Below those, there’s a summary of observation data and a picture from that cam, if any. You can see there are hourly and 10 day forecasts. Those are pretty much normal with a couple of exceptions. The hourly goes on for days and days, not the usual 36 hours or less, and both the hourly and 10 day will display a chance of precipitation percentage right on the storm cloud icon for that period. Both pages are as nicely set up and displayed as the rest of the app.
Many of the Weatherbug US station locations are schools, which can be both good and bad. In my case, there was an elementary school about 1/2 mile from my house, but that suddenly disappeared from the options. I’m not sure if that was because of a lack of funding (good weather stations are not necessarily cheap) or a lack of student interest. Either way, my next location option was more than three times as far away. I’ve never used Weatherbug in a more rural setting, but I’d expect there are probably areas where there aren’t any networked stations.


Other than that one glitch and unremovable ads, Weatherbug has a great display and tons of useful info. For many of us, it’s a keeper but that depends on location, too. There are versions for Android, iOS, Windows, Mac, Chrome, as well as web.
Weather Underground

If you go back to the days of Windows 95 & 98, you might recall a Windows shell replacement called LiteStep. It could modify how you saw and interacted with Windows. It was a nice customization tool to really change the look and feel. Part of that was the use of widgets, including things like rainmeter that used Weather Underground for conditions and forecasts. That was my introduction to WU, the oldest of the online weather networks.
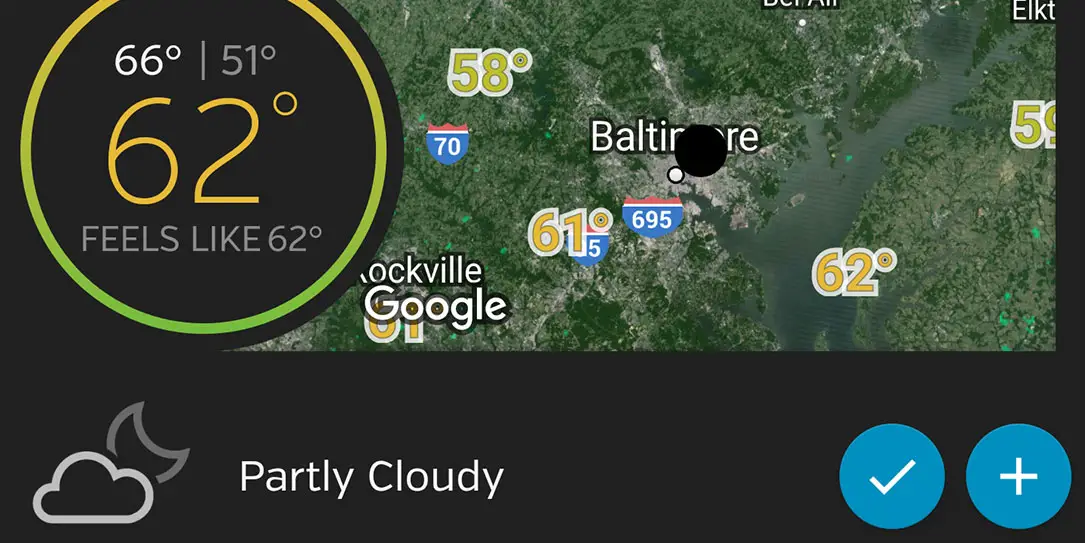
WU is one screen. You can switch locations by tapping on the location name. Then you get the one page for the next location selected. Take a look at the first screenshot. There are several things to note, at the top:
- Tapping on the temperature got me a message balloon comparing today’s temperature to yesterday’s.
- Tapping the small gray circled i at the top right get station info. Latitude and longitude, elevation, weather station model and brand, and more. That’s at least useful to the weather geeks.
- The map shows temperatures from the local stations, but tapping on it gets a larger map with more options. The overview shows stations with temperatures, plus radar. There are separate tabs for radar (without the stations showing) and for satellite view. Then there is the Layers view. You can select any or all of those, plus Severe Alerts, Crowd Reports, US Fronts, and Heatmap. It allows a custom map of exactly the info you want.
- The blue buttons probably won’t be used by most of us. They confirm or add to crowd source data for your location. If you don’t have any kind of station, pressing either isn’t really helpful.
- In the Forecast section of the page, you can choose the day, hourly (which, like Weatherbug, just keeps going), or summary. The summary displays day and evening for one day, but you can select any of seven days to display.
Our second screenshot shows the hourly display. Below that, mostly offscreen, is the Details section. That includes precipitation, humidity, dew point, visibility, and pressure. Which takes us to the third screenshot.


There’s sun and moon info in the third screen, simply select which tab you want. As you can see, there’s a Health section. The Air Quality tab includes numeric and bar displays for ozone, particulates, and pollen. The UV Index tab uses numeric, pyramid, and verbal representations of status. The Flu tab to the right gives graphic and verbal info. All of these, like Weatherbug, seem to be limited to the US.
Weather Underground has three more sections below that. On The Web has links to news, infographics, Twitter, ski reports, scientific discussion, and blogs. The next section displays hurricane and tropical cyclone info. If there’s an active NOAA weather radio station online for your area, the last section lets you listen in.
The three dots on the top bar gives you a menu for a few more things, including settings. In settings you can choose whether you use the light or dark theme (which seems unique to WU of the four we looked at), map type, whether there’s any temp/info display in the status bar, units of measure, severe weather alerts for one location, forecast source, and one of the links to removing ads.
Weather Underground is available for Android, iOS, and web. Yes, WU is ad supported and a $1.99 annual subscription removes ads and is supposed to get a faster update each time. That fits my tech miserliness. If you haven’t guessed, WU is my weather app of choice.Weatherbug, my second choice, has a couple more extras that I mostly wouldn’t use often. WU is more international and there’s WU weather station in the section of a city I may be spending considerable time in.
So, as TV detective Baretta used to say, “That’s the name of that tune.” As I’ve said, weather apps are a very personal thing. Try the four we recommend — if none does things your way, try some others till you find the right one. My “go to” weather app is Weather Underground. Do you already have a favorite? Tell us about it in the comments below, or on Google+, Twitter, or Facebook.